Exploration and description /EstimationScenario 1 First we can calculate This may be accomplished, for example for Lobamba Sub-region for cattle, by using the Pivot Table feature of Microsoft Excel for the variable cat_no in CS12Data1 (Data Pivot → Table and Pivot Chart Report...) as shown in `Descr_Stats' worksheet of CS12Data1 and illustrated below. Notice the ranges in numbers of cattle recorded per homestead. There is some evidence of skewness in the numbers of cattle (cat_no).
|
 (mean) and s2i (variance) for each dip-tank area.
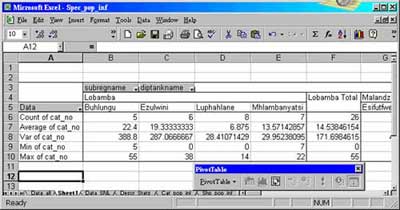
![]()
![]()
![]()